Database creation, visualization
Now that the data is flowing properly, and I have connected the API to my specific league’s info, I am ready to rock. The first thing I want to do is pull the draft information from the API, showing all of the picks from the 2022 draft. I prefer working with the pandas package for data, so I’ll import pandas and utilize the convenient draft() class to pull in some information regarding each draft pick. To round out some other columns needed for the analysis (most notably, total points scored over the season), I’ll combine that with another “for” loop adding in relevant player details that are stored within player_info().
“For” loops utilizing the draft() and player_info() classes that are built into the API.
After the above runs, I am left with a beautiful pandas data frame that has each player, when they were picked, their position, and their total points in 2022. I’ve also saved it to a CSV so that I won’t have to re-run this portion of the script and I can always just read this data frame from a CSV. We’re finally ready to get to the fun stuff.
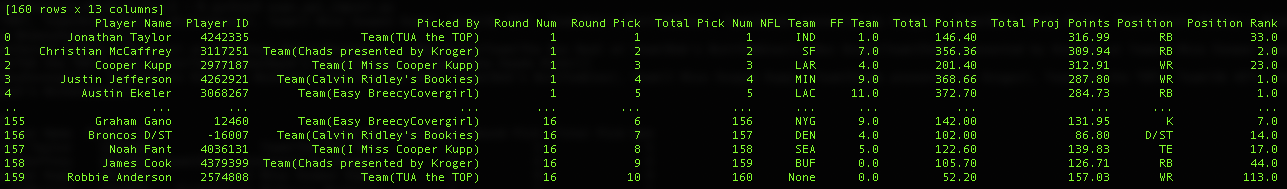
An output of the above data frame draft_df. It has all the info I need to do some basic draft analysis.
For visualizations like these, a scatter plot immediately comes to mind. I definitely want to look at the total points scored by each player, so I’ll do that.
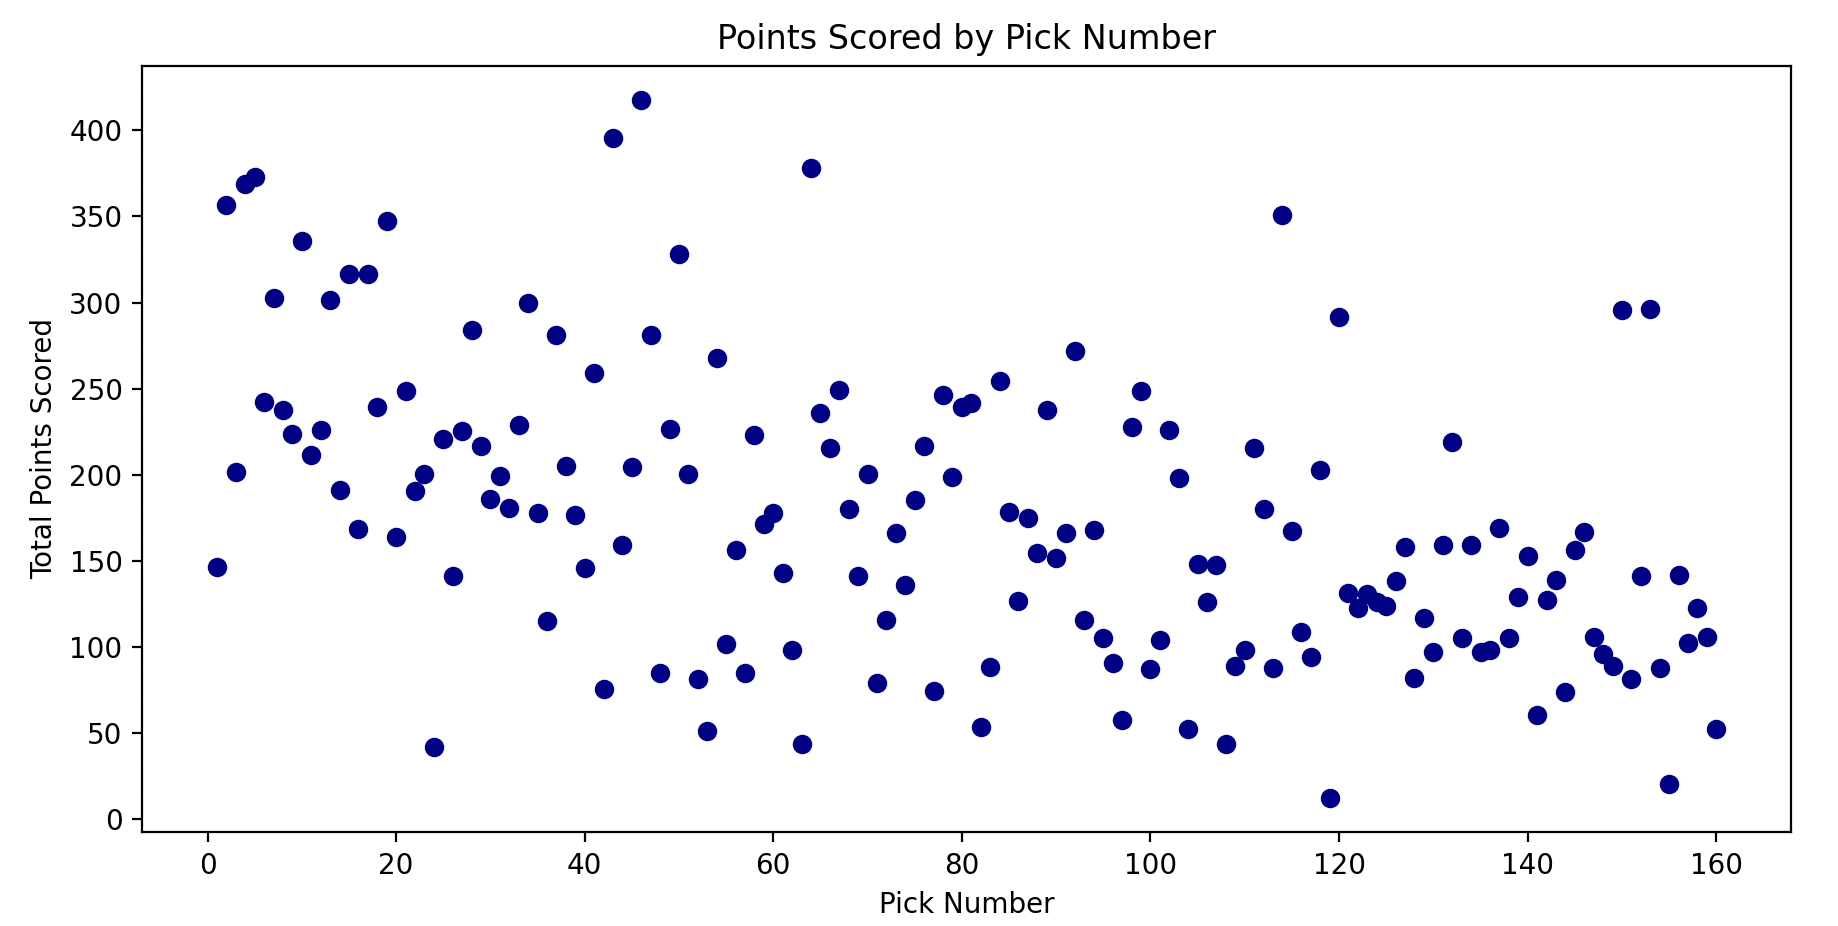
Total points scored by each pick in the draft.
Not bad! There’s definitely a downward trend, which means that in general we are picking the higher-performing players first. Good to know we’re at least better than random luck. But who are all those high-flying dots soaring above the rest from the 4th round on? Upon further investigation, those are the QBs, who even in a bad year are good for at least 200 points. Traditional fantasy football knowledge says that it’s best to wait to pick your QB until after the first few rounds, even if they’re going to score more points than a RB or WR, so I might need to set different standards for the point-scoring expectations of various position groups. I’ll separate the position groups and see where that gets me.


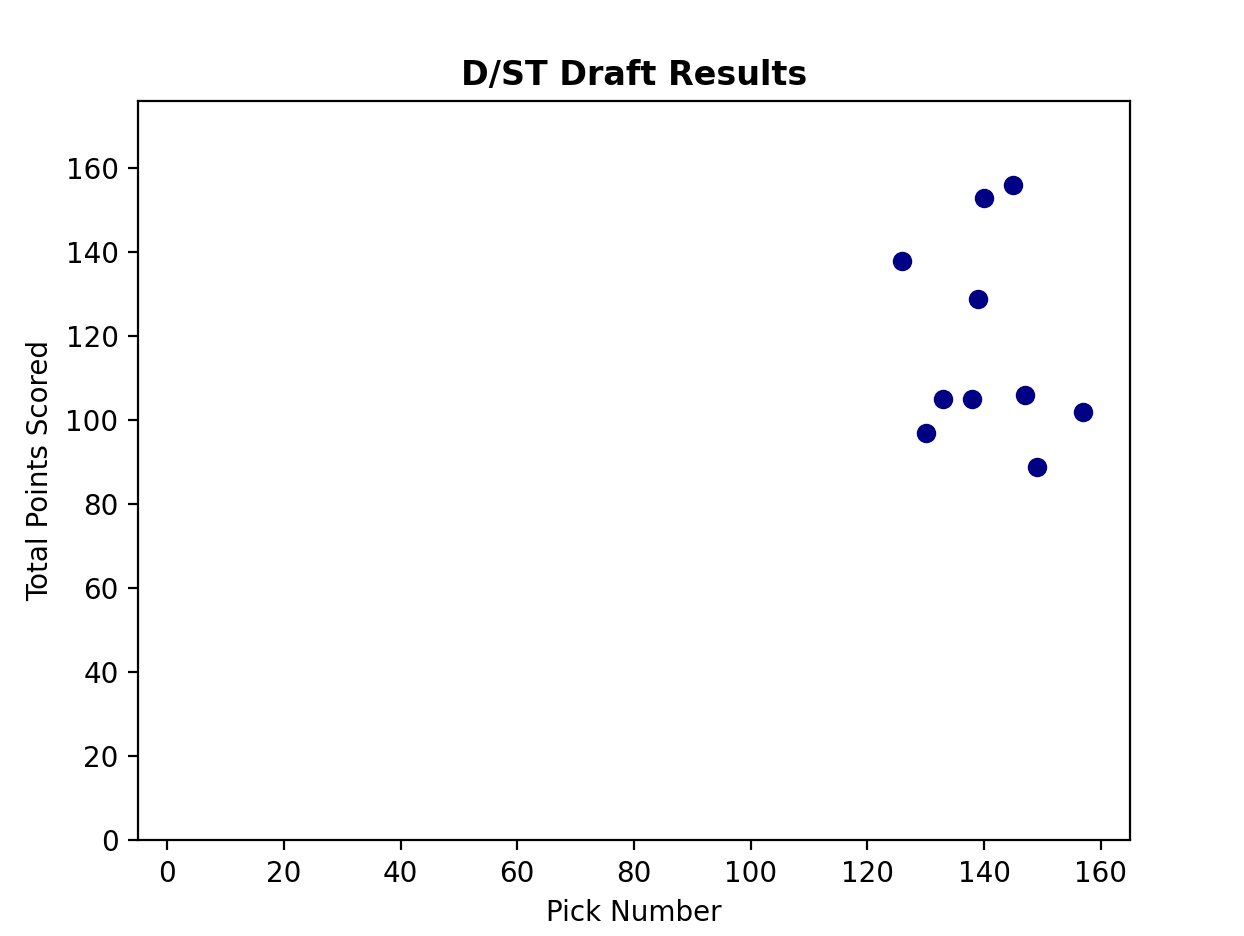

Ohhhhhhhhh yeah, now we’re getting somewhere. I absolutely love this view of the draft! I can see the ubiquity of RBs and WRs, which are drafted throughout every round, the more spread-out nature of QBs and TEs which only start to get drafted in about the 3rd, and the random-seeming clusters of Defenses and Kickers, all of which don’t get so much as a glance until the 12th round. THIS is the stuff that insights are made from. Now it’s time to somehow assign an expected value for each position group.